
Debt-to-Equity (D/E) Ratio: Financial Leverage and Capital Structure Analysis
The debt-to-equity ratio measures how much of an organization’s capital structure is made up of borrowed money and money that the owner has put into the business. This ratio represents essential inquiries regarding the optimal capital structure, as examined in the foundational studies by Modigliani and Miller (1958), which demonstrated that in ideal markets devoid of taxes, capital structure does not influence firm value. However, in the real world, where there are taxes, costs of bankruptcy, and problems with agents, the debt-to-equity ratio is very important for making decisions.

Definition of Debt-to-Equity Ratio
The debt-to-equity ratio (D/E ratio) is a financial leverage ratio that measures the proportion of a company’s total debt relative to its shareholders’ equity. It indicates how much debt a company is using to finance its assets compared to the amount of equity.
The D/E ratio shows the relative contributions of creditors and shareholders in financing a company’s assets.
Example
- If a company has $500,000 in total debt and $1,000,000 in equity:
- D/E Ratio = $500,000 ÷ $1,000,000 = 0.5 (or 0.5:1)
- This means the company has $0.50 of debt for every $1.00 of equity
Interpretation
- D/E = 1.0: Equal amounts of debt and equity (balanced)
- D/E < 1.0: More equity than debt (conservative, lower risk)
- D/E > 1.0: More debt than equity (aggressive, higher leverage)
- D/E = 2.0: Company has twice as much debt as equity
Formulations of Debt-to-Equity Ratio
The debt-to-equity ratio is mathematically expressed as:
D/E = Total Debt / Total Shareholders’ Equity
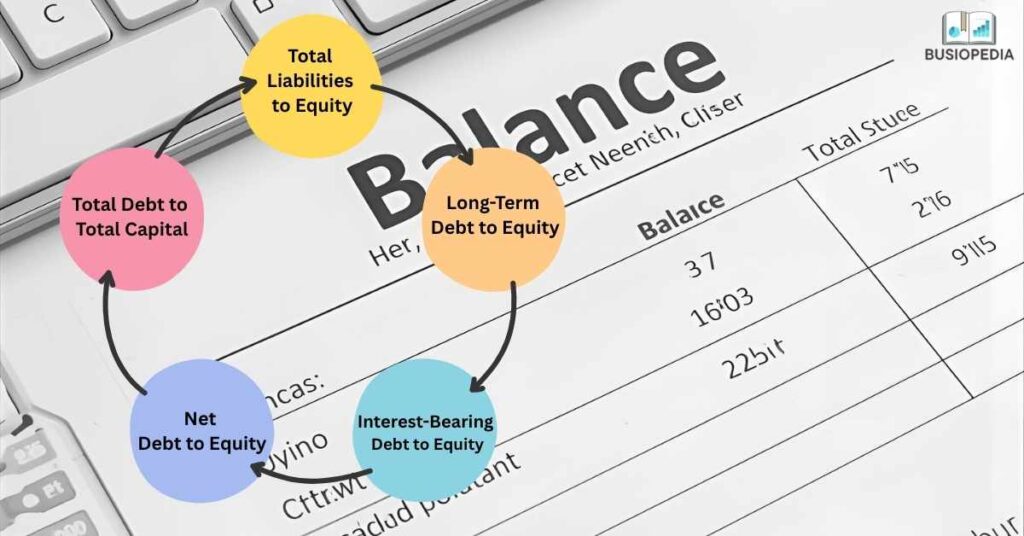
Academic literature recognizes several formulations, each serving specific analytical purposes:
1. Total Liabilities to Equity: Total Liabilities / Shareholders’ Equity
2. Long-Term Debt to Equity: Long-Term Debt / Shareholders’ Equity
3. Interest-Bearing Debt to Equity: Interest-Bearing Debt / Shareholders’ Equity
Selection among these formulations depends on analytical context, industry norms, and evaluation objectives.
Calculation Methodology and Examples
Basic Calculation
Consider a manufacturing corporation with the following balance sheet:
Balance Sheet Structure:
- Total Assets: $10,000,000
- Current Liabilities: $1,500,000
- Long-Term Debt: $3,500,000
- Total Liabilities: $5,000,000
- Total Equity: $5,000,000
Calculations:
- Using total liabilities: D/E = $5,000,000 / $5,000,000 = 1.0
- Using long-term debt: D/E = $3,500,000 / $5,000,000 = 0.7
Comparative Industry Analysis
Example 1: Technology Software Company
- Total Liabilities: $100 million
- Shareholders’ Equity: $400 million
- D/E Ratio = 0.25
This low ratio reflects the capital-light nature of software businesses requiring minimal physical assets.
Example 2: Electric Utility Company
- Total Liabilities: $7,000 million
- Shareholders’ Equity: $3,000 million
- D/E Ratio = 2.33
The higher ratio describes industries that need a lot of capital and infrastructure investments, and they have stable, regulated cash flows that support their ability to take on debt.
Example 3: Retail Corporation
- Total Liabilities: $1,200 million
- Shareholders’ Equity: $800 million
- D/E Ratio = 1.5
This moderate ratio is typical for the capital structure of the retail industry, as it balances the need for operational flexibility with the need for growth financing.
Risk-Return Analysis and Financial Leverage Effect
The debt-to-equity ratio shows how much risk and reward the management is willing to take. Higher leverage increases both potential returns and downside risk through fixed interest obligations.
Leverage Amplification Illustration
Two identical firms with $1,000,000 in assets generating $150,000 EBIT:
Firm A (Unlevered): D/E = 0
- Equity: $1,000,000
- Interest Expense: $0
- Net Income: $150,000
- ROE: 15%
Firm B (Levered): D/E = 1.5
- Equity: $400,000
- Debt: $600,000 at 6%
- Interest Expense: $36,000
- Net Income: $114,000
- ROE: 28.5%
The levered firm achieves 28.5% ROE versus 15% for the unlevered firm. However, if EBIT declines to $50,000, Firm A maintains 5% ROE while Firm B drops to 3.5%, demonstrating leverage’s “double-edged sword” nature.
Bankruptcy Risk and Agency Considerations
Academic research, especially Altman’s Z-Score model (1968), shows that there is a strong link between leverage ratios and the chance of bankruptcy. Higher debt-to-equity ratios raise the risk of financial trouble by:
- Cash Flow Pressure: Fixed obligations reduce operational flexibility during downturns
- Refinancing Risk: Challenges to refinancing maturing debt during credit disruptions
- Covenant Restrictions: Debt agreements limit managerial discretion
Jensen and Meckling’s (1976) agency theory demonstrates that debt serves as a disciplining mechanism while excessive leverage may incentivize risk-shifting behavior.
Industry Benchmarks and Context
Empirical research demonstrates systematic variation in optimal debt-to-equity ratios across industries:
Capital Structure Determinants
Asset Tangibility: Industries with substantial tangible assets (manufacturing, real estate) maintain higher leverage due to superior collateral values.
Cash Flow Stability: Regulated utilities with predictable cash flows support higher leverage than cyclical industries.
Growth Opportunities: High-growth sectors maintain lower leverage to preserve financial flexibility.
Profitability: Pecking order theory suggests profitable firms rely less on external debt, utilizing retained earnings preferentially.
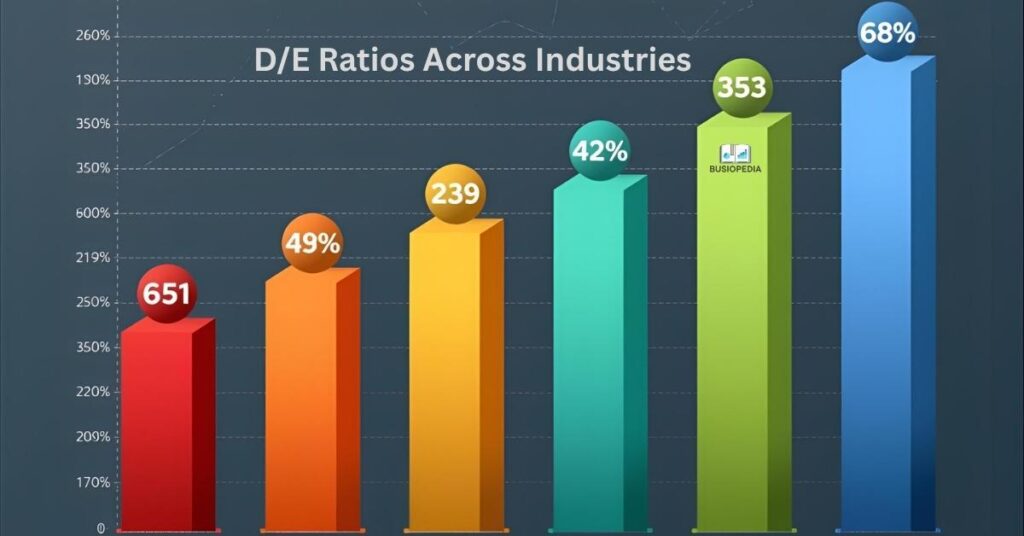
Statistical Benchmarks by Sector
- Technology/Software: 0.1 – 0.5
- Utilities: 1.5 – 3.0
- Telecommunications: 1.0 – 2.0
- Retail: 0.8 – 1.5
- Manufacturing: 0.6 – 1.2
- Real Estate: 2.0 – 4.0
- Healthcare Services: 0.4 – 0.9
These benchmarks provide comparative context but require interpretation considering firm-specific circumstances and strategic positioning.
Strategic Applications
Investment Analysis
Security analysts incorporate debt-to-equity ratios through multiple pathways:
Credit Risk Assessment: Fixed-income investors utilize leverage ratios as primary determinants of default probability. Higher ratios correspond to lower credit ratings and higher required yields.
Equity Valuation: Analysts adjust valuation multiples based on leverage, recognizing that highly levered firms require higher equity risk premiums.
Comparable Analysis: Analysts normalize for capital structure differences across peer firms, ensuring comparability in valuation exercises.
Corporate Finance Decisions
Financial managers utilize D/E analysis in:
Capital Raising: Existing leverage ratios inform debt-versus-equity choices, considering impacts on weighted average cost of capital and financial flexibility.
Share Repurchases: Leveraged recapitalizations increase D/E ratios, potentially creating tax benefits while increasing financial risk.
M&A Structuring: Deal structures balance consideration currency with post-transaction leverage targets
Limitations and Analytical Caveats
Measurement Challenges
Off-Balance-Sheet Financing: Operating leases and special purpose entities may understate true leverage, though modern accounting standards partially address this.
Market versus Book Values: Traditional calculations employ book values, yet market values may differ substantially. Market-based leverage ratios provide alternative perspectives.
Hybrid Securities: Convertible debt and preferred stock blur debt-equity distinctions, requiring judgment in classification.
Temporal Fluctuations: Point-in-time ratios may not reflect sustainable capital structures, particularly for firms with seasonal requirements.
Cross-Border Considerations
International comparisons face complexities from varying accounting standards, tax regimes, and regulatory frameworks. IFRS and US GAAP differences can create artificial leverage variations unrelated to fundamental financing differences.
Contemporary Developments
Pandemic Impact
The COVID-19 pandemic changed how leverage worked in a big way. Many companies took on a lot more debt to get cash flow, while others took advantage of low interest rates to refinance, which led to unprecedented differences in leverage within industries.
ESG Integration
Environmental, social, and governance (ESG) factors are playing a bigger role in decisions about capital structure. Research indicates that firms concentrating on ESG adopt more conservative leverage to retain flexibility for sustainability investments, whereas green bonds introduce new debt instruments that link leverage with ESG performance.
Fintech Innovation
Emerging financing mechanisms—crowdfunding, peer-to-peer lending, revenue-based financing—challenge traditional debt-equity dichotomies, requiring evolved analytical approaches.
Key Takeaways
- Fundamental Leverage Metric: The debt-to-equity ratio measures the proportion of debt financing relative to equity financing, serving as a primary indicator of financial leverage and capital structure composition.
- Multiple Formulations Exist: Choose between total liabilities, long-term debt, or interest-bearing debt formulations depending on analytical objectives. Each provides different insights into leverage profiles.
- Leverage Amplifies Returns and Risks: Higher D/E ratios magnify returns on equity during profitable periods but also amplify losses during downturns, demonstrating the double-edged nature of financial leverage.
- Industry Context Matters: Optimal D/E ratios vary significantly across industries based on asset tangibility, cash flow stability, growth opportunities, and profitability. Technology firms typically maintain 0.1-0.5 ratios while utilities operate at 1.5-3.0.
- Bankruptcy Risk Increases with Leverage: Higher debt-to-equity ratios correlate with increased bankruptcy probability through cash flow pressure, refinancing risk, and covenant restrictions, as demonstrated by Altman’s Z-Score research.
- Strategic Applications Are Diverse: Investors use D/E ratios for credit risk assessment and equity valuation, while corporate managers apply them in capital raising decisions, share repurchase programs, and M&A structuring.
- Measurement Challenges Require Caution: Off-balance-sheet financing, market versus book value differences, hybrid securities, and temporal fluctuations can distort D/E calculations, requiring careful interpretation.
- ESG and Innovation Impact Capital Structure: Contemporary developments, including ESG considerations, pandemic-driven changes, and fintech innovations, are reshaping traditional debt-equity relationships and optimal leverage targets.
Conclusion
The debt-to-equity ratio represents essential trade-offs between risk and return, signifies strategic management choices, and offers vital insights into the financial health of an organization. Academic research sheds light on the many complicated factors that determine the best capital structures in different situations by using theoretical frameworks like Modigliani-Miller, pecking order theory, and agency theory.
To use this information in real life, you need to take into account the unique features of the industry, the specific situation of the company, and the overall state of the economy. Higher leverage can boost equity returns and lower taxes, but it also raises the risk of bankruptcy and makes it harder to get money when you need it. The best debt-to-equity ratio for each organization comes from carefully weighing these competing factors in light of that organization’s own situation.
The debt-to-equity ratio is an important tool for investors, creditors, managers, and analysts when they know how to use it and put it in the right context. As financial markets change and new ways to borrow money come up, the basic ideas behind leverage analysis are still important for making smart financial decisions and fully evaluating a business.
Related Articles:
- Depletion for Oil, Gas & Mining: Complete Guide to Natural Resource Accounting
- Intangible Assets Valuation: A Complete Guide for Modern Businesses
- What is Depreciation: 4 Common Methods to Calculate
- Marketing Mix Modeling (MMM): Complete Analysis
- How to Calculate IRR (Internal Rate of Return): Step-by-Step Guide
- How to Calculate Amortization: Step-by-Step Guide
- How to Master Real Estate Accounting for Property Development
- What is Working Capital and How to Calculate: Your Complete Guide to Financial Success
- How to Create an Amazon Seller Account: Complete Step-by-Step Guide
- Top 5 Financial Ratios Every College Student Should Know (With Examples)
- How to Register an LLC in America: A Complete Guide for Beginners, Foreigners, and Entrepreneurs
- What is Inbound Marketing: Why Smart American Businesses Are Making the Switch
- Top 5 Best Bookkeeping Software to Work with Accounting: 2025 Guide
- Remote Marketing Jobs: A Step-by-Step Guide to Opportunities and Strategies to Succeed
- What are Accounts Payable? Its Definition, Process, and Best Practices
- 10 Fundamental Accounting Principles Every Business Owner Must Know
- Fixed Index Annuities: Your Way to Financial Confidence and Security
- QuickBooks Excellence: Transform Your Accounting Game with These Powerful Techniques
- Inbound vs. Outbound Marketing: The Great Debate That’s Reshaping Business Strategy
- How to Master Balance Sheet Analysis? Expert Guide with Examples
- Income Statement Formats: Complete 2025 Guide with Examples and Structure
- What Are Current Liabilities And Why They Matter For Financial Success
- Current Assets Essentials: Elevate Your Financial Management Game
- Remote Payroll Jobs: Your Gateway to Flexibility and Financial Growth
- Payroll Advance: Powerful Ways to Enhance Workplace Morale
- Powerful Mobile Marketing Strategies You Must Try
- Best Marketing Tools In An Advertising Plan
- Mastering Revenue Expenditure for Business Success
- Market Research And Its Importance: A Comprehensive Review
- What You Should Know? Notes Payable And Accounts Payable
- Digital Marketing And Strategies: A Comprehensive Review with Examples
- Are Annuities the Best Investment for a Bright Future? A Comprehensive Analysis
- Understanding Capital Expenditure: Definition, Significance, and Its Association in Financial Decision-Making
- Difference Between Accounting And Finance: A Proven Comprehensive Guide For Beginners
- Difference between Annuity due and Ordinary Annuity
- Essential Accounting Software for Small Enterprises
- 5 Best Software For Small Business Accounting