
How to Master Balance Sheet Analysis? Expert Guide with Examples
Have you ever wondered how successful investors and business owners quickly assess a company’s financial health? The secret lies in understanding one crucial document that most people find intimidating: the balance sheet. But here’s the good news: mastering balance sheet analysis isn’t as complicated as it seems, and once you get it, you’ll have a superpower that helps you make smarter financial decisions.

A balance sheet is a picture of the financial activities of your business at a specific date. While an income statement shows how your business performed over a period (like a movie), a balance sheet represents your financial position at a specific date on one exact day (like a photograph). It’s the financial equivalent of checking your bank account balance, but for an entire business.
You’ve probably heard the phrase “balancing the books,” and that’s exactly what this document does. Every balance sheet must balance, hence the name. This fundamental principle has guided business accounting for centuries and has always been one of the most reliable ways to understand a company’s true financial position.
Whether you’re a small business owner trying to understand your company’s financial health, an investor evaluating potential opportunities, or a student learning the fundamentals of accounting, this guide will transform how you view and analyze balance sheets. We’ll explore complex concepts into simple, actionable insights that you can start using immediately.
What Exactly Is a Balance Sheet?
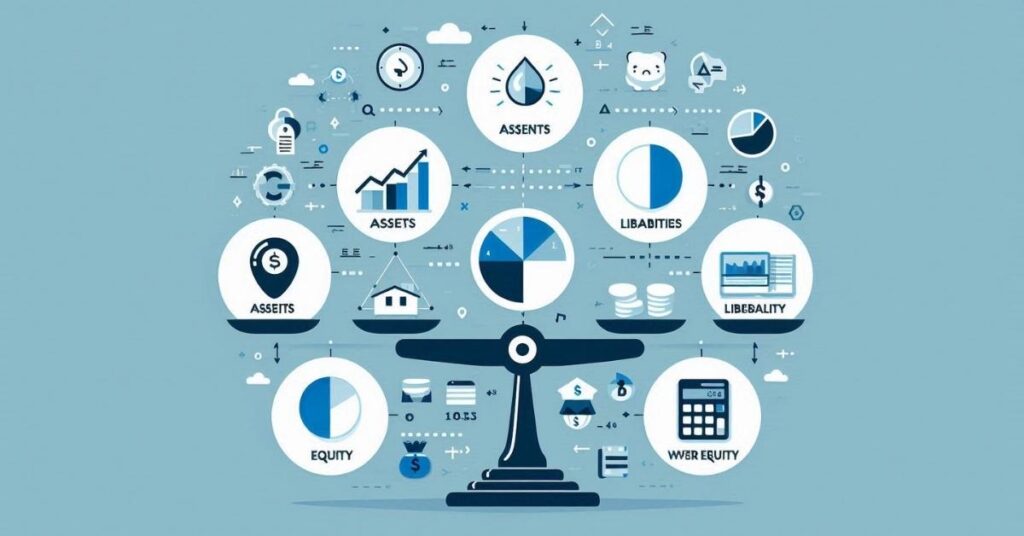
Let’s start with a simple definition that makes sense. A balance sheet is a crucial part of financial statements that shows what a company owns, what it owes, and what’s left over for the owners at a specific point in time. It’s built on one fundamental equation that always holds:
Assets = Liabilities + Shareholders’ Equity
Think of this equation like a simple math problem. If you own a house worth $300,000 (asset) but still owe $200,000 on your mortgage (liability), your Equity in the house is $100,000. The same principle applies to businesses, just with more complexity.
Why Is It Called a Balance Sheet?
The name comes from the fact that both sides of the equation must always balance. If they don’t balance, something’s wrong with your accounting. It’s like a seesaw that must have equal weight on both sides to stay level.
This balancing act isn’t just an accounting rule, it reflects a fundamental economic reality. Everything a company owns was either bought with borrowed money (liabilities) or with the owners’ money (Equity). There’s no third option.
The Three Essential Elements of Every Balance Sheet
Every balance sheet, regardless of size or industry, contains these three essential components:
Assets: Everything the company owns that has value. It includes cash, inventory, equipment, buildings, and even intangible items like patents or brand recognition.
Liabilities: Everything the company owes to others. It includes loans, unpaid bills, taxes owed, and future obligations like employee pensions.
Shareholders’ Equity: What’s left for the owners after all debts are paid. It includes the original investment by owners plus any profits the company has retained over time.
Understanding Assets: What Your Business Owns

Assets are like the tools in your business toolbox – they’re resources you use to generate income and run your operations. But not all assets are created equal, and understanding the differences is crucial for effective analysis.
Current Assets: The Quick Money
Current assets are resources that you can convert to cash within one year. These are your most liquid assets – think of them as your business’s readily available funds.
Cash and Cash Equivalents: This is exactly what it sounds like, money in bank accounts, cash in hand, petty cash, and short-term investments in marketable securities that can be quickly converted to cash. Smart businesses maintain adequate cash reserves for unexpected opportunities or challenges.
Accounts Receivable: Money that customers owe the business for products or services already delivered or rendered. If you sold something on credit, it becomes accounts receivable until the customer pays. The key here is making sure these receivables are actually collectible, which a business has to collect from its customers on their due dates.
Inventory: Inventory is the physical goods that a business holds in order to resell them. This includes raw materials, work-in-progress, and finished goods. Managing inventory effectively is crucial because too much ties up cash, while too little can hurt sales.
Prepaid Expenses: Money you’ve paid in advance for services you’ll receive later, like insurance premiums or rent paid ahead of time.
Non-Current Assets: The Long-Term Investments
Non-current assets (also called fixed assets) are resources you plan to use for more than one year. These are typically the big-ticket items that help you run your business.
Property, Plant, and Equipment (PPE): Buildings, machinery, vehicles, computers, and other physical assets used in operations. These assets typically decrease in value over time through depreciation.
Intangible Assets: Valuable resources you can’t physically touch, such as patents, trademarks, copyrights, and goodwill. In today’s knowledge economy, intangible assets often represent significant value.
Long-term Investments: Stocks, bonds, or other investments the company plans to hold for more than one year.
Understanding Liabilities: What Your Business Owes

Liabilities represent your business obligations – money you owe to others or services you need to provide. Like assets, liabilities are categorized based on when they need to be paid.
Current Liabilities: The Immediate Obligations
Current liabilities must be paid within one year. These are your short-term obligations that require immediate attention in your cash flow planning.
Accounts Payable: Money that a business owes to suppliers for goods or services it received but hasn’t paid for yet. This is like using a credit card for business purchases.
Short-term Loans: Bank loans, lines of credit, or other borrowings that need to be repaid within one year.
Accrued Expenses: Expenses you’ve incurred but haven’t paid yet, such as employee wages, utilities, or taxes.
Unearned Revenue: Money customers have paid you for goods or services you haven’t delivered yet. This might seem odd to call it a liability, but you owe them either the product/service or their money back.
Non-Current Liabilities: The Long-Term Commitments
Non-current liabilities are obligations that extend beyond one year. These typically represent major financing decisions and long-term commitments.
Long-term Debt: Mortgages, equipment loans, and other borrowings with payment terms longer than one year.
Pension Obligations: Promises to pay employee retirement benefits in the future.
Deferred Tax Liabilities: These are the taxes that will be owed in the future due dates according to accounting and tax rules.
Understanding Shareholders’ Equity: What Belongs to the Owners
Shareholders’ Equity represents the owners’ stake in the business. It would theoretically be left if you sold all assets and paid off all liabilities. Think of it as the net worth of the business.
Components of Shareholders’ Equity
Share Capital: The money investors originally put into the business when they bought shares. This represents the owners’ initial investment.
Retained Earnings: It is the amount of profits that the company has earned over time but hasn’t distributed to shareholders as dividends. These accumulated profits are reinvested in the business.
Additional Paid-in Capital: Money received from shareholders above the par value of shares during the issuance of stocks.
Balance Sheet Formats: Choosing Your Presentation Style
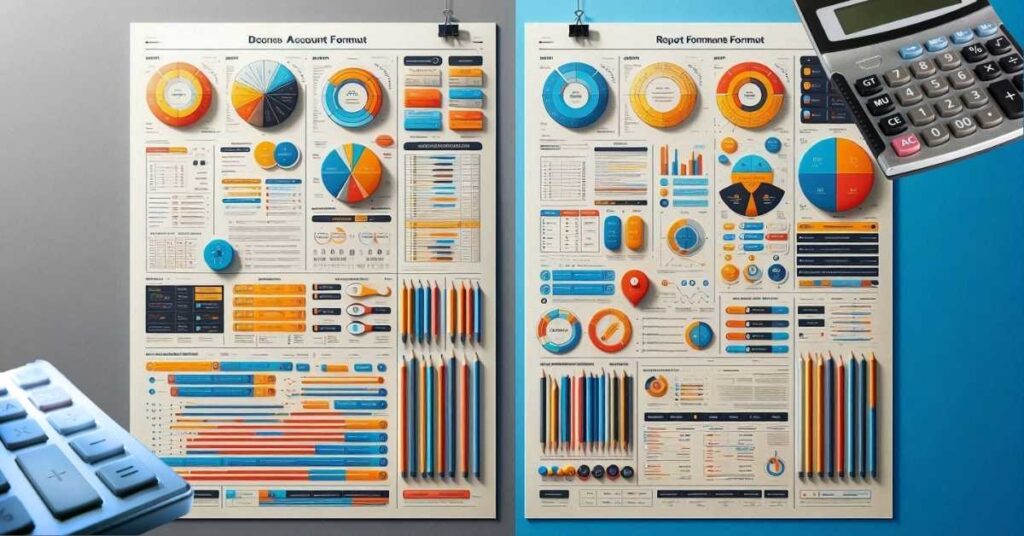
Just like income statements, balance sheets can be presented in different formats. The choice depends on your audience, regulatory requirements, and personal preferences.
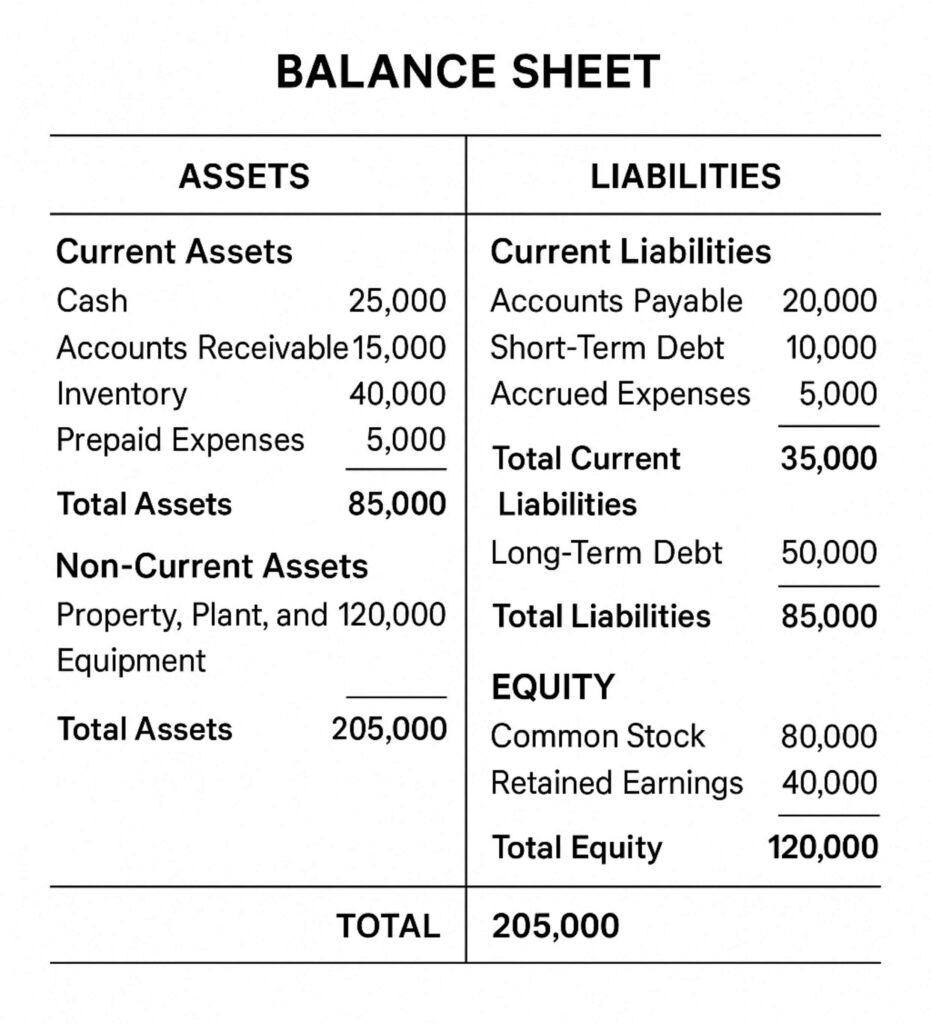
Account Format: The Traditional Approach
The account format presents assets on the left side and liabilities plus Equity on the right side, just like the fundamental equation. This format visually demonstrates the balance between what you own and what you owe, plus owner investment.
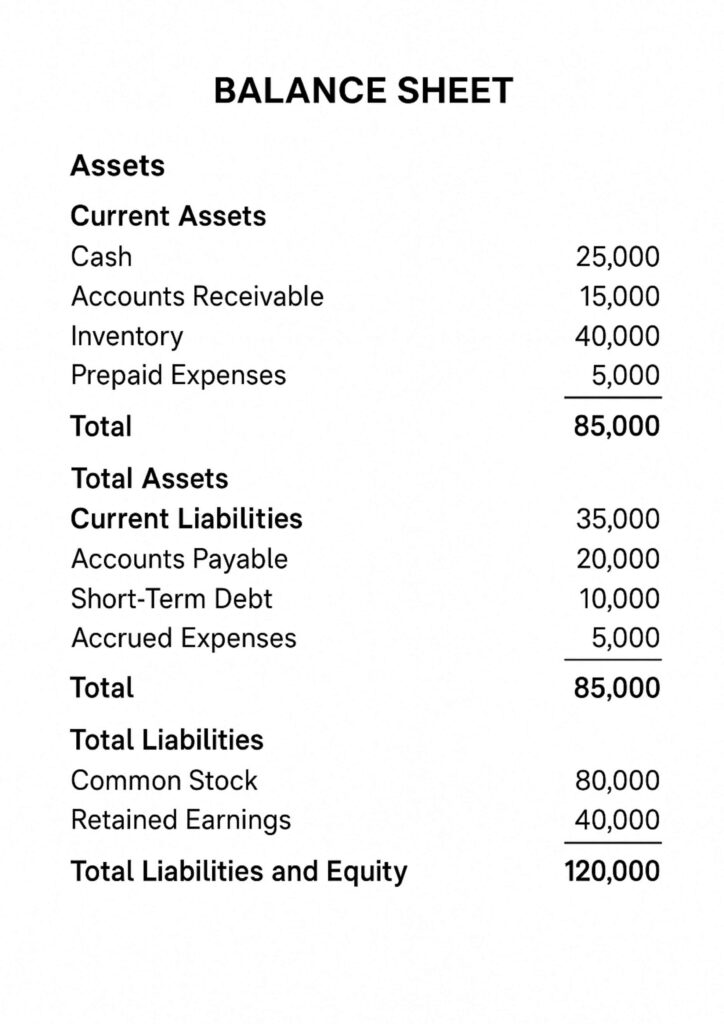
Report Format: The Vertical Approach
The report format lists everything vertically, starting with assets, followed by liabilities, and ending with shareholders’ Equity. This format is more common in modern financial reporting because it’s easier to read and fits better on standard-sized paper.
Which Format Should You Choose?
Use Account Format When:
- You want to emphasize the balancing concept visually
- You’re teaching accounting fundamentals
- You have space constraints that favor side-by-side presentation
- You’re following traditional industry practices
Use Report Format When:
- You’re preparing formal financial statements for external users
- You want easier reading and analysis
- You’re using standard accounting software (most default to this format)
- You need to fit the statement on standard paper sizes
Balance Sheet Analysis: Reading Between the Numbers

Now comes the exciting part – using your balance sheet actually to understand your business’s financial health. This is where the magic happens and where you’ll start seeing patterns that others miss.
Liquidity Analysis: Can You Pay Your Bills?
The first question any balance sheet should answer is: “Does this business have enough readily available resources to pay its short-term obligations?” This is called liquidity analysis.
Current Ratio: (Current Assets / Current Liabilities)
- A ratio above 1.0 means you can cover short-term debts and obligations efficiently.
- A ratio of 2.0 or above is typically considered a healthy position for the business.
- If the ratio is too high, that means you are not using assets in other investment opportunities.
Quick Ratio: (Current Assets – Inventory) / Current Liabilities
- Quick Ratio is more traditional than the current Ratio because inventory can be difficult to convert into cash quickly
- Particularly important for businesses with slow-moving inventory
Cash Ratio: (Cash and cash Equivalents / Current Liabilities)
- The most conventional liquidity measure
- It shows the ability of a business to pay short-term debts and obligations with immediately available funds
Leverage Analysis: How Much Debt Is Too Much?
Understanding how much debt your business carries relative to its assets and Equity helps assess financial risk and borrowing capacity.
Debt-to-Equity Ratio: Total Liabilities ÷ Shareholders’ Equity
- Higher ratios indicate more financial Leverage and risk
- Lower ratios suggest conservative financing, but possibly missed opportunities
- Industry standards vary significantly
Debt-to-Assets Ratio: Total Liabilities ÷ Total Assets
- Shows what percentage of assets are financed through debt
- Useful for comparing companies of different sizes
Efficiency Analysis: Are You Using Assets Wisely?
These ratios help you understand how effectively your business uses its available resources to generate sales and earn profits.
Asset Turnover: (Net Sales / Average Total Assets)
- Measures how efficiently you use assets to generate revenue
- Higher ratios generally indicate better asset utilization
- Compare with industry benchmarks for meaningful insights
Working Capital: Current Assets – Current Liabilities
- Measures short-term financial health and operational efficiency
- Positive working capital indicates the ability to fund operations
- Negative working capital might signal cash flow challenges
Industry-Specific Balance Sheet Considerations

Different industries have exclusive features that affect how you should interpret balance sheet information. What’s normal for one industry might be concerning for another.
Manufacturing Companies
Manufacturing businesses typically show:
- High PPE values from machinery and equipment
- Significant inventory across raw materials, work-in-progress, and finished goods
- Longer cash conversion cycles due to production timeframes
- Higher debt levels from equipment financing
Key focus areas: Inventory turnover, equipment utilization, working capital management.
Retail Businesses
Retail companies usually feature:
- Large inventory investments that vary seasonally
- Shorter cash conversion cycles than manufacturers
- Significant accounts receivable if they offer customer credit
- Location-based assets like store fixtures and leasehold improvements
Key focus areas: Inventory management, same-store sales productivity, seasonal cash flow patterns.
Service Companies
Service businesses often show:
- Lower asset levels since they don’t manufacture products
- Higher proportion of current assets due to receivables from services
- Significant intangible assets like client relationships and intellectual property
- People-focused cost structures reflected in compensation accruals
Key focus areas: Receivables collection, human capital efficiency, and client retention impacts.
Technology Companies
Tech companies frequently display:
- High cash balances from rapid growth and profitability
- Significant intangible assets from software development and patents
- Minimal physical assets due to digital business models
- Stock-based compensation impacts on Equity
Key focus areas: Cash burn rates, intellectual property value, scalability metrics.
Common Balance Sheet Red Flags to Watch For
As you develop your analysis skills, certain warning signs should immediately catch your attention. These red flags don’t necessarily indicate problems, but they definitely warrant further investigation.
Liquidity Warning Signs
Declining Cash Balances: If cash decreases significantly without explanation, investigate whether the business is struggling with cash flow or making major investments.
Increasing Accounts Receivable: Growing receivables might indicate collection problems, customer financial difficulties, or aggressive revenue recognition practices.
Rapid Inventory Growth: Inventory growing faster than sales could signal demand problems, obsolete products, or poor inventory management.
Leverage Concerns
Increasing Debt Levels: Rising debt without corresponding asset growth might indicate cash flow problems or over-leveraging.
Covenant Violations: Check notes to financial statements for any mentions of debt covenant violations or modifications.
Quality of Assets
Goodwill Impairments: Write-downs of goodwill often indicate that previous acquisitions aren’t performing as expected.
Aging Receivables: Old receivables are less likely to be collected and might require write-offs.
Balance Sheet Analysis in Practice: A Step-by-Step Approach

Let’s walk through a practical example of how to analyze a balance sheet systematically. This step-by-step process will help you develop a consistent approach to financial analysis.
Step 1: Get the Big Picture
Start by looking at the overall size and structure:
- What’s the total asset base?
- How is it divided between current and non-current assets?
- What’s the debt-to-equity ratio?
- Does the balance sheet actually balance?
Step 2: Assess Liquidity
Calculate the key liquidity ratios:
- Current Ratio for general liquidity health
- Quick Ratio for conservative liquidity assessment
- Working capital for operational funding adequacy
Step 3: Evaluate Leverage
Understand the financing structure:
- How much debt does the company carry?
- Is the debt level appropriate for the industry?
- Are debt payments manageable given the current cash flow?
Step 4: Analyze Asset Quality
Look deeper into asset composition:
- Are receivables current and collectible?
- Is inventory appropriate for sales levels?
- Are fixed assets productive and well-maintained?
Step 5: Compare Over Time
Single-period analysis only tells part of the story:
- How have key ratios changed over the past 2-3 years?
- Are trends positive or concerning?
- Do changes align with business strategy?
Step 6: Benchmark Against Industry
Context matters enormously in financial analysis:
- How do key metrics compare to industry averages?
- Where does the company rank among competitors?
- Are differences explained by business strategy or performance issues?
Advanced Balance Sheet Techniques
Once you’re comfortable with basic analysis, these advanced techniques will help you uncover deeper insights that separate expert analysts from casual observers.
Trend Analysis: Spotting Patterns
Calculate percentage changes in key balance sheet items over multiple periods. Look for:
- Consistent growth patterns in assets and Equity
- Concerning trends in debt accumulation
- Seasonal patterns that affect working capital
- One-time events that distort normal trends
Common-Size Analysis: Leveling the Playing Field
Convert all balance sheet items to percentages of total assets. This technique allows you to:
- Compare companies of different sizes
- Identify structural changes over time
- Spot unusual concentrations in specific areas
- Benchmark against industry norms more effectively
Du Pont Analysis: Connecting Balance Sheet to Performance
The Du Pont framework connects balance sheet efficiency to overall profitability by breaking down return on Equity into parts:
- Profit margin (from the income statement)
- Asset turnover (using balance sheet and income statement)
- Financial Leverage (from balance sheet)
This analysis reveals whether strong returns come from operational efficiency, asset utilization, or financial Leverage.
Key Points
- Master the Fundamental Equation: Assets always equal liabilities plus shareholders’ Equity. This balance reflects the basic economic reality that everything owned was financed either through debt or owner investment.
- Focus on Liquidity First: Use current Ratio, quick Ratio, and working capital analysis to assess whether the business can meet short-term obligations and fund daily operations effectively.
- Understand Asset Quality: Not all assets are equal – evaluate receivables for collectibility, inventory for turnover efficiency, and fixed assets for productivity and maintenance needs.
- Analyze Leverage Carefully: Debt can accelerate growth, but also increases risk. Use debt-to-equity and debt-to-assets ratios to assess whether leverage levels are appropriate for the business and industry.
- Compare Within Industry Context: What’s normal varies dramatically between industries. Manufacturing companies naturally carry more fixed assets, while service companies typically have higher receivables relative to total assets.
- Track Changes Over Time: Single-period analysis provides limited insight. Focus on trends over 2-3 years to identify improving or deteriorating financial health patterns.
- Connect Balance Sheet to Operations: The most valuable analysis links balance sheet items to operational performance. High inventory might indicate poor demand forecasting, while growing receivables could signal collection problems.
- Use Multiple Analysis Techniques: Combine ratio analysis, trend analysis, and common-size analysis for a comprehensive understanding. No single metric tells the complete story of financial health.
Conclusion
Mastering balance sheet analysis is like learning to read a financial roadmap – once you understand the language, you can navigate complex business decisions with confidence. The balance sheet provides insights that no other financial statement can offer, revealing the fundamental financial structure and stability of any business.
Remember that balance sheet analysis is both an art and a science. While ratios and calculations provide objective measures, interpreting them requires understanding the business context, industry dynamics, and strategic direction. The most successful analysts combine technical skills with business intuition to uncover insights that drive better decision-making.
As you practice these techniques, start with businesses you understand well, then gradually expand to more complex situations. Pay attention to how different industries and business models affect balance sheet presentation and analysis. Most importantly, always connect your balance sheet analysis to the broader business story – financial statements are tools for understanding business performance, not ends in themselves.
Whether you’re evaluating investment opportunities, managing your own business, or advancing your financial education, strong balance sheet analysis skills will serve you throughout your career. The principles you’ve learned here apply universally, from small startups to multinational corporations. Start applying these concepts today, and you’ll quickly develop the expertise that sets successful business professionals apart from the crowd.
Related Articles:
- Income Statement Formats: Complete 2025 Guide with Examples and Structure
- What Are Current Liabilities And Why They Matter For Financial Success
- Current Assets Essentials: Elevate Your Financial Management Game
- Remote Payroll Jobs: Your Gateway to Flexibility and Financial Growth
- Payroll Advance: Powerful Ways to Enhance Workplace Morale
- Powerful Mobile Marketing Strategies You Must Try
- Best Marketing Tools In An Advertising Plan
- Mastering Revenue Expenditure for Business Success
- Market Research And Its Importance: A Comprehensive Review
- What You Should Know? Notes Payable And Accounts Payable
- Digital Marketing And Strategies: A Comprehensive Review with Examples
- Are Annuities the Best Investment for a Bright Future? A Comprehensive Analysis
- Understanding Capital Expenditure: Definition, Significance, and Its Association in Financial Decision-Making
- Difference Between Accounting And Finance: A Proven Comprehensive Guide For Beginners
- Difference between Annuity due and Ordinary Annuity
- Essential Accounting Software for Small Enterprises
- 5 Best Software For Small Business Accounting